

Published: 8 October 2019
Greenhouse gas emissions in energy supply and land transport declined in 2017
Greenhouse gas emissions produced by Finnish residents and other emissions into air not included in greenhouse gases decreased in 2017. Greenhouse gas emissions produced by Finnish residents in Finland and abroad amounted to 59 million tonnes, which was almost five per cent less than in the previous year. The drop was biggest in land transport, where emissions decreased by 10 per cent compared to 2016. Carbon dioxide emissions from biomass, in turn, grew by five per cent from the previous year, being 40 million tonnes. Other emissions than greenhouse gas emissions also decreased. The biggest drop of nearly 11 per cent was seen in sulphur dioxide emissions.
Greenhouse gas emissions by industry 2015 and 2016, million tonnes CO2 equivalent
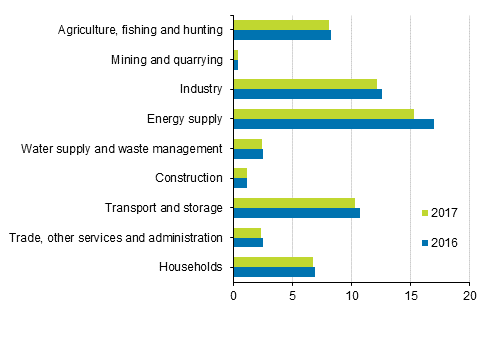
The main reason for the reduction in greenhouse gas emissions was a decrease in emissions in energy supply. Emissions in energy supply declined by 10 per cent from the year before. All other emissions into air not included in greenhouse gases also decreased in energy supply compared to 2016. The biggest change, a 17 per cent drop, was seen in sulphur dioxide emissions.
Energy supply’s annual emission volumes have varied considerably especially on account of electricity imports and production of fossil condensate energy, whose volumes are, in turn, dependent on the availability of hydro power in the Nordic electricity market.
The fact that the share of biofuels increased in transport fuels also lowered greenhouse gas emissions. This is particularly visible in the industry of land transport, where emissions fell by 10 per cent from the previous year, and in households where emissions decreased by close on two per cent compared to 2016.
Households’ emissions generated in heating of dwellings remained almost unchanged compared to the previous year. Carbon dioxide emissions from biomass increased in energy supply by close on three per cent from 2016 as a result of increased use of biofuels. Carbon dioxide emissions from biomass are generated from combustion of biomass.
Emissions into air by industry groups 2017, tonnes
| Greenhouse gases (CO2-foss, CH4, N2O, HFC, PFC, SF6) CO2-eq. | Carbon dioxide emissions from biomass (CO2-bio) | Particles, < 10 m (PM 10) | Carbon monoxide (CO) | Ammonia (NH3) | |
| Agriculture, fishing and aquaculture, hunting | 7 763 349 | 802 582 | 3 110 | 18 435 | 27 826 |
| Forestry | 363 185 | 5 501 | 107 | 6 846 | 4 |
| Mining and quarrying | 441 488 | 381 | 1 162 | 1 477 | 0 |
| Food industry | 221 383 | 30 783 | 421 | 230 | 2 |
| Forest industry | 2 920 957 | 19 624 767 | 2 477 | 26 180 | 48 |
| Oil refining and manufacture of chemicals | 3 934 473 | 156 314 | 525 | 1 084 | 320 |
| Manufacture of basic metals and fabricated metal products | 3 380 660 | 3 877 | 391 | 1 516 | 115 |
| Other industries | 1 686 567 | 107 597 | 239 | 326 | 195 |
| Energy management | 15 265 769 | 11 771 117 | 1 256 | 20 886 | 12 |
| Water supply and waste management | 2 457 050 | 324 265 | 82 | 472 | 102 |
| Construction | 1 200 141 | 52 217 | 538 | 6 290 | 41 |
| Trade | 502 034 | 9 519 | 28 | 161 | 3 |
| Land transport | 3 819 231 | 520 055 | 3 294 | 3 673 | 396 |
| Water transport | 3 106 592 | 213 913 | 778 | 10 206 | 4 |
| Air transport | 3 216 582 | 19 929 | 236 | 4 933 | 12 |
| Support activities for transportation, postal activities | 117 902 | 21 346 | 360 | 487 | 4 |
| Real estate activities | 132 170 | 32 359 | 76 | 537 | 7 |
| Other service activities and administration | 1 687 621 | 201 685 | 1 712 | 20 260 | 78 |
| Households | 6 750 034 | 6 345 160 | 12 833 | 207 161 | 1 897 |
| TOTAL | 58 967 188 | 40 243 367 | 29 625 | 331 160 | 31 066 |
The statistics on emissions into air by industry are calculated according to the EU Regulation on environmental accounts. The goal of environmental accounts is to describe the interaction between the environment and the economy by mainly using the same basic concepts and classifications as national accounts (ESA 2010). The industrial classification and division used in the statistics differ from the sector division used in the reporting of the greenhouse gas emissions to the UNFCCC. The statistics do not take into consideration the amount of carbon dioxide absorbed by forest or other vegetation either.
Differing from the greenhouse gas inventory and greenhouse gas reporting, the statistics on emissions into air by industry also contain Finnish residents' emissions from land, water and air transport abroad. In turn, emissions by foreign citizens from transport on Finnish territory are subtracted from the emissions into air by industry. Due to definitional differences, the total volume of greenhouse gas emissions by industry is higher than in the Greenhouse Gas Inventory reported to the UNFCCC.
Source: Emissions into air by industry 2017, Statistics Finland
Inquiries: Juuso Peltola 029 551 2330, Kai Skoglund 029 551 2675, ymparistotilinpito@stat.fi
Director in charge: Ville Vertanen
Publication in pdf-format (341.4 kB)
- Tables
-
Tables in databases
Pick the data you need into tables, view the data as graphs, or download the data for your use.
Appendix tables
- Appendix table 1. Greenhouse gas emissions (CO2-fos, CH4, N2O, HFC, PFC, SF6) by industry as carbon dioxide equivalents (CO2 eq.) in 2008 to 2017, tonnes (8.10.2019)
- Appendix table 2. Carbon dioxide emissions from biomass fuels (CO2-bio) by industry in 2008 to 2017, tonnes (8.10.2019)
- Appendix table 3. Ammonia emissions (NH3) by industry in 2008 to 2017, tonnes (8.10.2019)
- Appendix table 4. Sulphur dioxide emissions (SO2) by industry in 2008 to 2017, tonnes (8.10.2019)
- Appendix table 5. Nitrogen dioxide emissions (NO2) by industry in 2008 to 2017, tonnes (8.10.2019)
- Appendix table 6. Carbon monoxide emissions (CO) by industry in 2008 to 2017, tonnes (8.10.2019)
- Appendix table 7. Particulate matter emissions (PM 10) by industry in 2008 to 2017, tonnes (8.10.2019)
- Appendix table 8. Particulate matter emissions (PM 2.5) by industry in 2008 to 2017, tonnes (8.10.2019)
Updated 8.10.2019
Official Statistics of Finland (OSF):
Emissions into air by industry [e-publication].
ISSN=2323-7600. 2017. Helsinki: Statistics Finland [referred: 26.4.2024].
Access method: http://www.stat.fi/til/tilma/2017/tilma_2017_2019-10-08_tie_001_en.html