

Published: 27 April 2010
Unemployment rate 9.1 per cent in March
According to the Labour Force Survey of Statistics Finland, there were 18,000 more persons unemployed in March 2010 than in March 2009. The unemployment rate grew by 0.8 percentage points to 9.1 per cent from one year ago. The number of employed persons decreased by 48,000.
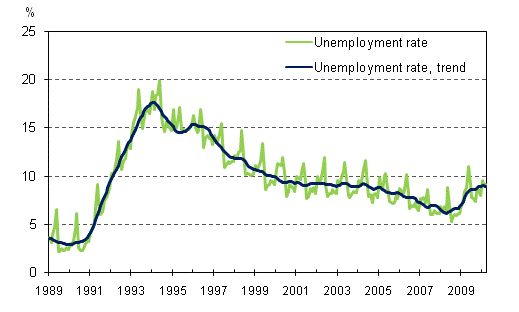
Unemployment rate and trend of unemployment rate 1989/01 – 2010/03
In March 2010, the number of employed persons was 2,400,000, which was 48,000 lower than a year earlier. The decrease in the number of employed centred in the areas of the Regional State Administrative Agencies (AVI) of Southern Finland, Southwestern Finland, and Northern Finland.
In March, the employment rate , that is, the proportion of the employed among persons aged 15 to 64, stood at 66.5 per cent, which was 1.5 percentage points lower than one year before. Adjusted for seasonal and random variation, the trend of the employment rate was 67.4 per cent. From last year’s March, men’s employment rate fell by 0.7 percentage points to 66.9 per cent and women’s by 2.4 percentage points to 66.2 per cent.
According to the Labour Force Survey of Statistics Finland, there were 240,000 unemployed in March 2010, i.e. 18,000 more than in March of the year before. The number of unemployed men grew by 12,000 and that of unemployed women by 6,000.
At 9.1 per cent, the unemployment rate was 0.8 percentage points higher in March than one year earlier. The trend of the unemployment rate was 8.9 per cent in March. The unemployment rate for men rose by 0.8 percentage points to 10.5 per cent, and that for women by 0.7 percentage points to 7.5 per cent. In March 2010, the unemployment rate among young people aged 15 to 24 was 25.5 per cent, which was 3.9 percentage points higher than in March of the year before. The trend of the unemployment rate among young people was 23.7 per cent. The unemployment rate was lowest in the areas of Southern Finland AVI, where it stood at 7.6 per cent, and highest, at 14.3 per cent, in the area of Lapland AVI.
The number of 15 to 74-year-olds not belonging to the labour force grew by 50,000 persons, of whom 42,000 were women.
N.B . The latest trend figures, which are partly based on projections, should be viewed with certain reservations.
Changes in the labour force 2010/03 – 2009/03 according to Statistics Finland’s Labour Force Survey
| Year/Month | Change | ||
| 2010/03 | 2009/03 | 2010/03 - 2009/03 | |
| 1000 persons | Per cent (%) | ||
| Population aged 15–74 | 4 038 | 4 019 | 0,5 |
| Labour force, total | 2 639 | 2 670 | –1,1 |
| Employed, total | 2 400 | 2 448 | –2,0 |
| – employees | 2 069 | 2 105 | –1,7 |
| – self-employed persons and unpaid family workers | 331 | 342 | –3,3 |
| Unemployed persons | 240 | 222 | 7,9 |
| Total persons not in labour force | 1 399 | 1 349 | 3,7 |
| Per cent (%) | Percentage points | ||
| Employment rate (persons aged 15 to 64), % | 66,5 | 68,1 | –1,5 |
| Unemployment rate, % | 9,1 | 8,3 | 0,8 |
| Labour force participation rate, % | 65,4 | 66,4 | –1,1 |
| Unrounded figures are used in the
Change column. The data comply with the ILO/EU definition. |
|||
Labour Force Survey data for the first quarter of 2010
The average number of employed persons in the first quarter of 2010 was 2,388,000, or 59,000 lower than in the corresponding quarter of 2009. More than half of the decrease in employment came from the economic activity group of manufacturing (–31,000). Other industries with clearly declining employment were construction (–11,000), sale of motor vehicles (–7,000) and social work activities without accommodation (–10,000). The number of persons employed in the activity of education grew by 10,000.
In the first quarter of the year the average number of unemployed persons was 244,000, which was 42,000 higher than in the January to March period of 2009. The unemployment rate in the first quarter of the year was 9.3 per cent, which was 1.6 percentage points higher than in the respective period of 2009.
In 2009, the number of hours worked decreased in all quarters of the year. In the first quarter of 2010 the number of hours worked by employed persons totalled 985 million, which was on level with the respective quarter of 2009.
Changes in the labour force 2010/I – 2009/I according to Statistics Finland’s Labour Force Survey
| Year/Quarter | Change | ||
| 2010/I | 2009/I | 2010/I - 2009/I | |
| 1000 persons | Per cent (%) | ||
| Labour force, total | 2 632 | 2 650 | –0,7 |
| Employed, total | 2 388 | 2 448 | –2,4 |
| Unemployed, total | 244 | 202 | 20,6 |
| – men | 143 | 114 | 25,5 |
| – women | 101 | 89 | 14,2 |
| Unrounded figures are used in the
Change column. The data comply with the ILO/EU definition. |
|||
Employment Service Statistics of the Ministry of Employment and the Economy
At the end of March 2010, there were altogether 275,000 persons registered, in accordance with the Unemployment Security Act and the Employment Office Regulations, as job seekers at the employment and economic development offices . The number of unemployed job seekers was 24,000 higher than in March 2009.
Unemployment grew from the previous year in the areas of all other ELY Centres apart from those of Kainuu (–11%) and North Karelia (–7%). The number of unemployed job seekers increased most in Ĺland (27%), Varsinais-Suomi (26%), Uusimaa (19%) and Pirkanmaa (13%). At the end of March, the number of temporarily laid off persons registered at the employment and economic development offices was 31,000, which was 4,000 lower than twelve months earlier.
The number of persons covered by labour market policy measures totalled 90,000 the end of March, which was 5,000 more than in March of the year before. Altogether 3.4 per cent of the labour force was covered by labour market policy measures.
There were 32,000 unemployed job seekers aged under 25 registered at the employment and economic development offices. Their number was 3,000 higher than in last year’s March. During this March, 53,000 new vacancies were reported to the employment and economic development offices, which is 7,000 more than in March 2009.
Changes 2010/03 – 2009/03 according to the Employment Service Statistics of the Ministry of Employment and the Economy
| Year/Month | Change | ||
| 2010/03 | 2009/03 | 2010/03 - 2009/03 | |
| 1000 persons | Per cent (%) | ||
| Unemployed job seekers | 275 | 251 | 9,5 |
| – unemployed over a year | 51 | 40 | 28,9 |
| Total measures | 90 | 85 | 5,8 |
| – employed with subsidised measures | 31 | 35 | –9,7 |
| – in labour market training | 37 | 33 | 13,1 |
| – in trainee and job alternation places | 21 | 17 | 23,6 |
| New vacancies at employment and economic development offices | 53 | 45 | 16,1 |
| Unrounded figures are used in the Change column. | |||
Contact information for the Ministry of Employment and the
Economy:
Mr Petri Syvänen, tel. +359 10 604 8050, http://www.tem.fi/employmentbulletin
Links
Updated tables of the Labour Force Survey: http://tilastokeskus.fi/til/tyti/tau_en.html
Differences between the Labour Force Survey and the Employment Service Statistics are explained in the quality description of the Labour Force Survey.
Latest seasonally adjusted employment figures published by the EU can be found under the theme of Population and social conditions on Eurostat's home page http://epp.eurostat.ec.europa.eu.
Job vacancy survey: http://tilastokeskus.fi/til/atp/index_en.html
Source: Labour force survey 2010, March. Statistics Finland
Inquiries: Juha Martikainen (09) 1734 3225, Kalle Sinivuori (09) 1734 3524, Anna Pärnänen (09) 1734 2607, tyovoimatutkimus@stat.fi
Director in charge: Riitta Harala
Publication in pdf-format (609.0 kB)
- Tables
-
Tables in databases
Pick the data you need into tables, view the data as graphs, or download the data for your use.
Appendix tables
- 1.1 Key indicators in the Labour Force Survey by sex 2010/03 - 2009/03 (27.4.2010)
- 1.2 Population aged 15-74 by labour force status and sex 2010/03 - 2009/03 (27.4.2010)
- 1.3 Population aged 15-74 by sex and age 2010/03 - 2009/03 (27.4.2010)
- 2.1 Labour force participation rate by sex and age 2010/03 - 2009/03 (27.4.2010)
- 2.2 Labour force by sex and age 2010/03 - 2009/03 (27.4.2010)
- 3.1 Employment rate by sex and age 2010/03 - 2009/03 (27.4.2010)
- 3.2 Employed persons by sex and age 2010/03 - 2009/03 (27.4.2010)
- 3.3 Employed persons by status in employment 2010/03 - 2009/03 (27.4.2010)
- 3.4 Employed persons by employer sector 2010/03 - 2009/03 (27.4.2010)
- 3.5 Employed persons by Regional State Administrative Agencies (AVI) 2010/03 - 2009/03 (27.4.2010)
- 3.6 Proportion of part-time employed persons in all employed persons by sex 2010/03 - 2009/03 (27.4.2010)
- 3.7 Part-time employed persons by sex 2010/03 - 2009/03 (27.4.2010)
- 4.1 Employees by type of employment relationship (%) 2010/03 - 2009/03 (27.4.2010)
- 4.2 Employees by type of employment relationship 2010/03 - 2009/03 (27.4.2010)
- 5.1 Unemployment rate by sex and age 2010/03 - 2009/03 (27.4.2010)
- 5.2 Unemployed persons by sex and age 2010/03 - 2009/03 (27.4.2010)
- 5.3 Unemployment rate by Regional State Administrative Agencies (AVI) 2010/03 - 2009/03 (27.4.2010)
- 6.1 Seasonally adjusted trends 2010/03 (27.4.2010)
- 7.1 Key indicators in the Labour Force Survey by sex 2010/I - 2009/I (27.4.2010)
- 7.2 Population aged 15-74 by labour force status and sex 2010/I - 2009/I (27.4.2010)
- 7.3 Population aged 15-74 by sex and age 2010/I - 2009/I (27.4.2010)
- 8.1 Labour force participation rate by sex and age 2010/I - 2009/I (27.4.2010)
- 8.2 Labour force by sex and age 2010/I - 2009/I (27.4.2010)
- 9.1 Employment rate by sex and age 2010/I - 2009/I (27.4.2010)
- 9.2 Employed persons by sex and age 2010/I - 2009/I (27.4.2010)
- 9.3 Employed persons by status in employment 2010/I - 2009/I (27.4.2010)
- 9.4 Employed persons by industry (TOL 2008) 2010/I - 2009/I (27.4.2010)
- 9.5 Hours actually worked of employed persons by industry (TOL 2008) 2010/I - 2009/I (27.4.2010)
- 9.6 Employed persons by employer sector 2010/I - 2009/I (27.4.2010)
- 9.7 Employed persons by Regional State Administrative Agencies (AVI) 2010/I - 2009/I (27.4.2010)
- 9.8 Employed persons by region 2010/I - 2009/I (27.4.2010)
- 9.9 Proportion of part-time employed persons in all employed persons by sex 2010/I - 2009/I (27.4.2010)
- 9.10 Part-time employed persons by sex 2010/I - 2009/I (27.4.2010)
- 10.1 Employees by industry (TOL 2008) 2010/I - 2009/I (27.4.2010)
- 10.2 Hours actually worked of employees by industry (TOL 2008) 2010/I - 2009/I (27.4.2010)
- 10.3 Employees by type of employment relationship (%) 2010/I - 2009/I (27.4.2010)
- 10.4 Employees by type of employment relationship 2010/I - 2009/I (27.4.2010)
- 10.5 Different types of employment relationships less than 12 month's duration (%) 2010/I - 2009/I (27.4.2010)
- 10.6 Different types of employment relationships less than 12 month's duration 2010/I - 2009/I (27.4.2010)
- 11.1 Unemployment rate by sex and age 2010/I - 2009/I (27.4.2010)
- 11.2 Unemployed persons by sex and age 2010/I - 2009/I (27.4.2010)
- 11.3 Unemployment rate by Regional State Administrative Agencies (AVI) 2010/I - 2009/I (27.4.2010)
- 11.4 Unemployment rate by region 2010/I - 2009/I (27.4.2010)
- Figures
-
- 1.1 Employed and trend of employed (27.4.2010)
- 1.2 Employment rate and trend of employment rate (27.4.2010)
- 2.1 Unemployed and trend of unemployed (27.4.2010)
- 2.2 Unemployment rate and trend of unemployment rate (27.4.2010)
- Quality descriptions
-
- Quality Description: Labour force survey (27.4.2010)
Updated 27.04.2010
Official Statistics of Finland (OSF):
Labour force survey [e-publication].
ISSN=1798-7857. March 2010. Helsinki: Statistics Finland [referred: 20.4.2024].
Access method: http://www.stat.fi/til/tyti/2010/03/tyti_2010_03_2010-04-27_tie_001_en.html