

Published: 16 November 2018
Cost of an hour worked EUR 34.1 for an employer in 2016
Corrected on 8 January 2019.
The corrected numbers are indicated in red
Heading revised. Was previously: Cost of an hour worked EUR 34.2
for an employer in 2016
According to Statistics Finland's Labour Cost Survey, labour costs were, on average, EUR 34.1 per hour worked in 2016. The hourly costs were EUR 34.7 in the private sector, EUR 31.4 in the local government sector, and EUR 38.6 in the central government sector. Wage and salary costs formed, on average, 76.0 per cent, social security costs 21.5 per cent, and other costs 2.5 per cent of total labour costs in the sectors.
Cost of an hour worked and the cost per staff-year by employer sector in 2016
| Sector / industry | Labour cost, per hour worked, EUR | Labour cost per staff-year, EUR |
| Sectors total | 34.1 | 55 331 |
| Private sector total | 34.7 | 57 368 |
| Manufacturing, total (B-E) | 37.2 | 62 401 |
| Construction (F) | 34.0 | 59 302 |
| Service Industry (G-S) | 33.9 | 55 394 |
| Consumer and business services (G-N) | 33.3 | 55 126 |
| Welfare services (O-S) | 35.6 | 56 054 |
| Local government sector | 31.4 | 48 740 |
| Central government | 38,6 | 59 296 |
In the private sector, the cost of an hour worked was highest in the manufacturing industries (B-E) and lowest in consumer and business services (G-N). Examined by sector, the central government sector had the highest cost of an hour worked, EUR 38.6 , while cost of an hour worked was lowest in the local government sector, EUR 31.4. In the central government sector, the high cost level is explained by the personnel focusing on expert professions that, on average, have a high pay level. The central government sector also has longer holiday periods than the private sector, which decreases the number of hours worked compared with the private sector. Due to longer holiday periods, the cost of an hour worked in the central government sector is higher than in manufacturing, even though the cost per staff-year is lower than in manufacturing. The number of hours worked by sector is presented in Table 1 in addition to cost of an hour worked and cost per staff-year.
In the local government sector, the labour cost is lowest among the sectors both per an hour worked and per staff-year. Even though the number of hours worked is lower in the local government sector than in the private sector due to holidays and the social costs are higher than in other sectors, the wage and salary costs of the local government sector are clearly lower than in the other sectors.
Labour costs are derived when the compensations for costs received by the employer (reimbursement of pay for periods of sickness, compensations from occupational health care, and employment subsidy) have been deducted from the employer's wage and salary costs, social security costs, and other labour costs. The hours worked have been calculated by deducting the absences, like annual leaves and sick leaves, from the sum of regular working time and overtime hours.
In manufacturing, the cost of an hour worked grows by the size of the enterprise
In the private sector, the cost per an hour worked in manufacturing industries (B-E) was EUR 31.6 in the smallest enterprises with 10 to 49 wage and salary earners, while the average cost per an hour worked was EUR 42.4 in the largest enterprises. The cost grows by the size of the enterprise. The largest cost difference is between the mid-size categories, i.e. when moving from enterprises with 50 to 249 wage and salary earners to those with 250 to 499 wage and salary earners. In welfare services (O-S), the cost of an hour worked also grows the larger the enterprise is measured by the number of personnel. In construction, in enterprises with 50 to 249 wage and salary earners, the cost of an hour worked is higher than in enterprises with 250 to 499 wage and salary earners, but otherwise the cost rises as the size of the enterprise grows.
Cost of an hour worked in the private sector by industry and size of enterprise in 2016
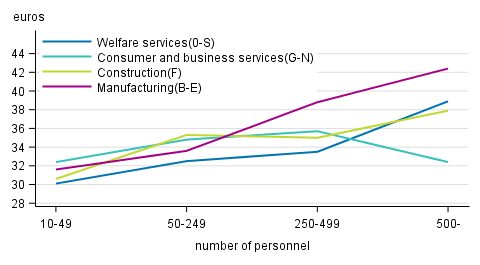
Smaller enterprises (10 to 49 wage and salary earners) in welfare services (O-S) have the lowest cost per hour. In consumer and business services (G-N) the cost is largest in the two middle size categories. There are low-pay dominated enterprises among the large enterprises in consumer and business services, for example, in the industries of property maintenance and trade, as well as labour rental. This largely explains the lower cost level in larger enterprises.
The variation by industry in the cost of an hour worked is small when comparing smaller enterprises with 10 to 49 wage and salary earners. In these enterprises, the average cost per hour varies by good EUR two, from EUR 30.1 in welfare services (O-S) to EUR 32.4 in consumer and business services (G-N). The larger the enterprise size category, the clearer the difference in hourly costs between industries become. The industry-specific hourly costs in the largest enterprises with over 500 wage and salary earners vary from EUR 32.4 in consumer and business services (G-N) to EUR 42.4 in manufacturing (B-E).
The differences in hourly costs in enterprises of different sizes are mainly explained by wage and salary costs that are the higher the larger the enterprise is. Part of the social insurance contributions are also higher the larger the enterprise in question is. In manufacturing, the largest enterprises also pay on average more performance-based bonuses and other one-off items than smaller enterprises.
Enterprises with fewer than ten employees are not included in the Labour Cost Survey.
Other than wage and salary costs form 23.6 per cent of labour costs in the private sector
Other than wage and salary costs, that is, social security costs and other labour costs, represent 23.6 per cent of total labour costs in the private sector. The share of other than wage and salary costs is highest in the local government sector, where social security costs and other labour costs account for 26.4 per cent of total costs. The corresponding share in the central government sector is 20.2 per cent.
The wage and salary cost consists of direct earnings and other wages and salary costs such as one-off pay items and remuneration for days off. In the statistics, social security costs include actual social security costs, that is statutory, agreement-based and voluntary social insurance contributions, pay during sick leave, pay related to child birth and child care, and occupational health care costs.
Structure of labour costs in the private sector, the central government sector and local government sector in 2016, per cent of total labour costs
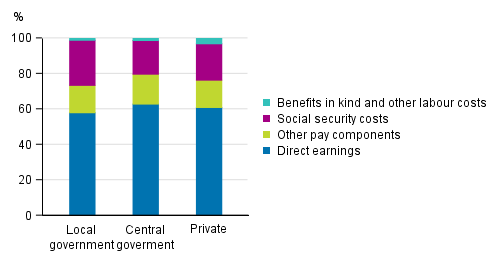
Other labour cost items include benefits in kind, costs of in-service training, costs for industrial and protective clothing, recruitment costs, and the costs of personnel funds. The share of these cost items is highest in the private sector, 3.0 per cent, while it is 1.1 per cent in the local government sector and 1.2 per cent in the central government sector. The larger share of other labour costs in the private sector compared with the central and local government sectors is primarily the result of the higher portion of benefits in kind in the private sector.
Source: Labour cost survey 2016 Statistics Finland
Inquiries: Pekka Haapala 029 551 3460, Olli Ruuska 029 551 3274, tvk@stat.fi
Director in charge: Mari Yl�-Jarkko
Publication in pdf-format (262.6 kB)
- Tables
-
Tables in databases
Pick the data you need into tables, view the data as graphs, or download the data for your use.
Appendix tables
- Appendix table 1. Hours worked, cost of an hour worked and labour cost per staff-year by industry (TOL2008) and sector in 2016 (the table was corrected 8 January 2019) (16.11.2018)
- Appendix table 2. Structure of labour costs by sector in 2016 (16.11.2018)
- Appendix table 3. Cost of an hour worked in the private sector by the number of personnel in the enterprise and by industry (16.11.2018)
Updated 16.11.2018
Official Statistics of Finland (OSF):
Labour cost survey [e-publication].
ISSN=1799-3288. 2016. Helsinki: Statistics Finland [referred: 19.4.2024].
Access method: http://www.stat.fi/til/tvtutk/2016/tvtutk_2016_2018-11-16_tie_001_en.html