

Published: 29 November 2013
Development of productivity in the national economy 1976-2012
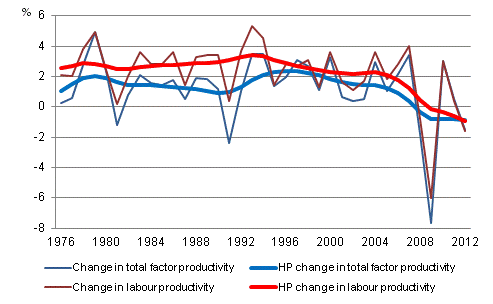
Based on preliminary national accounts data, the growth rate of labour productivity in the whole national economy was -1.6 per cent in 2012, having been 0.4 per cent in 2011 and 3.0 per cent in 2010. The respective growth rate of total factor productivity was -1.5 per cent in 2012, having been 0.5 per cent in 2011 and 3.0 per cent in 2010.
Development of productivity in the whole national economy 1976-2012*
*) The figures for 2011 and 2012 based on preliminary information
The Hodrick-Prescott filtered long-term growth trend (HP) indicates that the pace of growth in labour productivity has slowed down strongly in the whole economy since the mid-1990s, from 3.5 to -1.0 per cent in 2012. Although the annual growth rates for individual years (2000, 2004, 2007 and 2010) have been around three to four per cent, the trend in labour productivity has been declining since the mid-1990s.
The long-term growth trend for total factor productivity shows that total factor productivity fluctuated between 1.5 and 2 per cent before the year 1993. Between 1993 and 2000, total factor productivity grew at the average rate of 2 to 2.5 per cent per annum. Since 2000, the growth trend of total factor productivity has slowed down.
Table Average growths of productivity in the whole national economy 1976-2012 shows average annual changes of total factor productivity and labour productivity in different time periods. In addition, the table shows capital input, worked hours and labour composition contributions to value added growth, as well as capital intensity change and labour composition change contributions to labour productivity growth.
The contribution of labour composition to value added growth was strongest during the recession in 1990 to 1994, being 0.7 per cent per annum, on average. In the other periods, the contribution of labour composition to value added growth has been 0.1 to 0.3 percentage points per year. The contribution of capital intensity growth to value added has been fairly stable at an average of 0.7 to 1.0 percentage points per year. Growth has only been lower during the periods 1990 to 1994 and 2009 to 2012, about 0.3 and 0.4 percentage points per year.
Average growths of productivity in the whole national economy, 1976-2012*
| 1976-1989 | 1990-1994 | 1995-1999 | 2000-2004 | 2005-2008 | 2009-2012 | |
| Value added volume, change, % | 3,3 | -0,8 | 4,4 | 2,9 | 3,3 | -1,3 |
| Capital input contribution, change, % | 1,1 | 0,3 | 0,7 | 0,8 | 0,9 | 0,4 |
| Worked hours contribution, change, % | 0,4 | -3,2 | 1,5 | 0,4 | 1,0 | -0,4 |
| Labour composition contribution, change, % | 0,3 | 0,7 | 0,2 | 0,2 | 0,1 | 0,1 |
| Multi-factor productivity, change, % | 1,5 | 1,3 | 2,1 | 1,6 | 1,2 | -1,4 |
| Capital intensity contribution, change, % | 0,9 | 1,4 | 0,1 | 0,6 | 0,6 | 0,3 |
| Labour composition contribution, change, % | 0,3 | 0,7 | 0,2 | 0,2 | 0,1 | 0,3 |
| Labour productivity, change, % | 2,7 | 3,5 | 2,3 | 2,3 | 2,0 | -1,1 |
The productivity database EUKLEMS aiming at international comparability has been updated also for Finland according to the new Standard Industrial Classification (TOL2008). The productivity indicators presented in these statistics are based on the KLEMS method and to the same raw data as EUKLEMS, but the methods differ somewhat from those of the EUKLEMS database. A database suitable for international comparisons of productivity can be downloaded at: www.euklems.net .
Source: Productivity surveys 2012, Statistics Finland.
Inquiries: Jan Klavus 09 1734 3391, Antti Pasanen 09 1734 2629, kansantalous@stat.fi
Director in charge: Leena Storg�rds
- Tables
-
Tables in databases
Pick the data you need into tables, view the data as graphs, or download the data for your use.
Updated 29.11.2013
Statistics:
Productivity surveys [e-publication].
ISSN=2343-4333. 2012. Helsinki: Statistics Finland [referred: 19.4.2024].
Access method: http://www.stat.fi/til/ttut/2012/ttut_2012_2013-11-29_tie_001_en.html