

Published: 15 April 2020
Number of kilometres driven with cars in 2019 unchanged from the year before – kilometres for heavy vehicles decreased
In 2019, the total number of kilometres driven with passenger cars was 40,718 million car kilometres, i.e. as many as in the year before. The kilometres for heavy vehicles decreased last year. The traffic performance on highways was on level with the previous year. Last year, there were fewer new pavement projects than before.
The traffic performance on highways (mill. vehicle-km) in 1980–2019
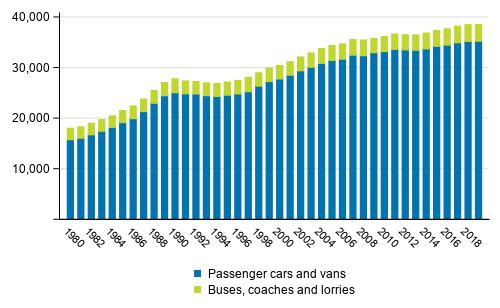
Total traffic performance
In 2019, the total number of kilometres driven with all vehicles, or the traffic performance, on the highway and street networks of Mainland Finland 1) amounted to 50,387 million car kilometres in total, which was 0.1 per cent lower than in 2018. The total number of kilometres driven with passenger cars was 40,718 million car kilometres, i.e. as many as in the year before. The total performance of vans increased by 0.6 per cent from the previous year.
The kilometres for heavy vehicles decreased in 2019. The traffic performance of lorries totalled 3,342 million car kilometres, which was 2.0 per cent down on the year before. Altogether 601 million kilometres were driven with buses, i.e. the traffic performance of buses decreased by 2.1 per cent from the previous year. The share of heavy vehicles was eight per cent of all traffic, as in the previous year.
According to the road traffic performance calculation, the number of passenger cars in the active passenger car fleet in Mainland Finland was 2,995,305, so last year, 13,600 kilometres, on average, were driven with passenger cars. An average of 11,000 kilometres were driven with petrol-driven passenger cars and 19,900 kilometres with diesel-driven cars. Of all drive-kilometres of cars, 57 per cent were driven with petrol-driven and 41 per cent with diesel-driven cars, the share of low-emission motive powers remained under two per cent.
Traffic performance on highways
In 2019, the traffic performance on highways 2) was on level with the previous year. In 2019, the total traffic performance on highways for light vehicles, that is, passenger cars and vans, increased by 0.1 per cent compared to the traffic performance on highways in 2018. The traffic performance on highways for heavy vehicles decreased by one per cent compared to 2018. The share of the highway network of total performance is 77 per cent and the share of street performance is 23 per cent.
In 2019, the highway performance of passenger cars increased by 0.1 per cent and the highway performance of vans by 0.6 per cent from 2018. The highway performance of heavy vehicle combinations decreased by 1.4 per cent and the same distance as in 2018 was driven with other lorries. The number of highway kilometres of buses declined by 2.1 per cent.
Fifty-two per cent of highway traffic was on class I main roads in 2019. Fourteen per cent of the traffic performance was on class II main roads, 18 per cent on regional roads and 16 per cent on connecting roads. The traffic performance of class I main roads was on level with the previous year, traffic on class II main roads and regional roads increased slightly and traffic on connecting roads decreased by close on one per cent. Altogether 30 per cent of the traffic performance took place in the area of the ELY centre of Uusimaa, that is, on the highways of the regions of Uusimaa, Kanta-H�me and P�ij�t-H�me.
In 2019, an average of 1,357 vehicles per day travelled on Finnish highways. Most vehicles travelled in the region of Uusimaa, or 5,024 vehicles per day on average. In the region of Kanta-H�me an average of 2,035 vehicles per day and in P�ij�t-H�me an average of 2,011 vehicles per day were recorded. The region of Kainuu had the least traffic, 430 vehicles per day on average.
Table 1. Traffic performance (mill. vehicle-km) on the Finnish highway and street network by vehicle category in 2019
| Vehicle class | Highways | Streets and private roads | Total |
| Cars total | 38,603 | 11,784 | 50,387 |
| Passenger car | 30,943 | 9,775 | 40,718 |
| Van | 4,358 | 1,368 | 5,726 |
| Light vehicles total | 35,301 | 11,143 | 46,444 |
| Bus and coach | 411 | 190 | 601 |
| Truck | 2,890 | 452 | 3,342 |
| Heavy vehicles total | 3,301 | 642 | 3,943 |
Passenger traffic performance
In 2019, the passenger traffic performance of passenger cars 3) was 66.8 billion passenger-kilometres in total, i.e. the same as in the year before. In 2019, the passenger traffic performance of bus transport was 7.9 billion passenger-kilometres in total. The passenger traffic performance of bus transport fell by two per cent from the previous year.
Finnish highways in 2019
At the end of 2019, the length of highways in Mainland Finland totalled 77,925 km, 17 km less than one year earlier. Of this, 50,992 km were connecting roads, 13,469 km regional roads, 8,605 km class I main roads and 4,859 km class II main roads. In addition, 1,386 km were ramps, 44 km roundabouts and 62 km ferry routes. Twenty-one per cent of highways are in North Savo, 16 per cent in North Ostrobothnia and Kainuu and 12 per cent in Lapland. These and the examinations by region mentioned below have been made according to the division of traffic by regional ELY centre. 4)
Of highways, 926 km were motorways and 136 km semi-motorways. The number of motorways has grown evenly over the years – in twenty years their number has almost doubled. There were altogether 6,026 km of paths for cyclists and pedestrians on highways. Twenty per cent of the paths were in Uusimaa, 15 per cent in Southwest Finland and 13 per cent in South Ostrobothnia.
Highway pavements
Thirty-seven per cent of highways are oil gravel roads (or corresponding), 35 per cent gravel roads and 28 per cent permanent pavement roads. The area of North Savo has the highest number of gravel roads, around one-half of the roads are gravel roads, while almost one-half of the road network in Uusimaa is permanently paved. The highest number of oil gravel roads is found in North Ostrobothnia, where 43 per cent of the road network consists of oil gravel roads. At the end of 2019, there were 50,706 kilometres of permanent pavement roads, i.e. 65 per cent of all highways in Mainland Finland. Almost all pavements were asphalt concrete or soft asphalt concrete. There were only 770 kilometres of surface-dressed gravel roads at the end of 2019.
Pavements on highways in 1980–2019
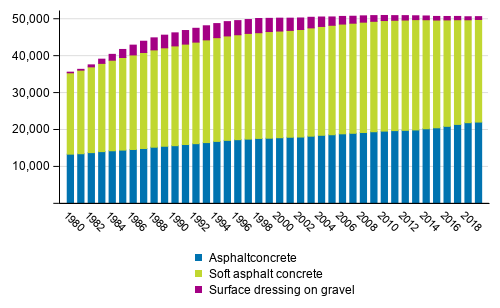
New pavement projects covered 1,734 km, which is the lowest number of pavement projects in the history of the statistics. Compared with the previous year they covered 717 km less. Pavement projects decreased most in the area of Lapland, where their number fell by 61 per cent from the previous year. In Southeast Finland pavement projects had also halved. Uusimaa had the lowest fall, pavement projects decreased by only 10 per cent from the previous year.
Other data
The length of lit-up highway sections was 12,874 km, 59 km more than in the previous year. Of speed limits, 80km/h is the most common covering 51,719 km, which is 394 km more than in the previous year. Areas with 120 km/h increased most, by around 10 per cent.
When it comes to the width of roads, the share of dual carriageway highways had increased most from the previous year, by around three per cent, and second most that of roads with a width of eight metres, by around two per cent.
1) The total performance of road traffic is based on data on odometer readings of Finnish vehicles saved in Traficom’s transport register at the time of inspection and the performance data produced from them by Statistics Finland. The results have been statistically inflated to correspond to the total performance of the vehicle category in question, i.e. passenger car, van, lorry and bus.
2) The traffic performance on highways is based on the results of the Finnish Transport Infrastructure Agency’s highway traffic calculations.
3) Passenger traffic performance is calculated from the traffic performance of vehicles by using a coefficient describing the average number of persons travelling in a vehicle.
4) The operating area of the Centre for Economic Development, Transport and the Environment of Uusimaa in terms of traffic and infrastructure covers the regions of Uusimaa, Kanta-H�me and P�ij�t-H�me. The operating area of Centre for Economic Development, Transport and the Environment of Southwest Finland in terms of traffic and infrastructure covers the regions of Southwest Finland and Satakunta. The operating area of the Centre for Economic Development, Transport and the Environment of Pirkanmaa in terms of traffic and infrastructure covers the region of Pirkanmaa. The operating area of the Centre for Economic Development, Transport and the Environment of Southeast Finland in terms of traffic and infrastructure covers the regions of Kymenlaakso and South Karelia. The operating area of the Centre for Economic Development, Transport and the Environment of North Savo in terms of traffic and infrastructure covers the regions of North Savo, South Savo and North Karelia. The operating area of the Centre for Economic Development, Transport and the Environment of Central Finland in terms of traffic and infrastructure covers the region of Central Finland. The operating area of the Centre for Economic Development, Transport and the Environment of South Ostrobothnia in terms of traffic and infrastructure covers the regions of South Ostrobothnia, Ostrobothnia and Central Ostrobothnia. The operating area of the Centre for Economic Development, Transport and the Environment of North Ostrobothnia in terms of traffic and infrastructure covers the regions of North Ostrobothnia and Kainuu. The operating area of the Centre for Economic Development, Transport and the Environment of Lapland in terms of traffic and infrastructure covers the region of Lapland.
Source: Transport and tourism, Statistics Finland
Inquiries: Sami Lahtinen 029 551 3207, Nico Maunula 029 551 3526, Matti Kokkonen 029 551 3770, sami.lahtinen@stat.fi
Director in charge: Mari Yl�-Jarkko
Publication in pdf-format (236.3 kB)
- Tables
-
Tables in databases
Pick the data you need into tables, view the data as graphs, or download the data for your use.
Updated 15.04.2020
Official Statistics of Finland (OSF):
Finnish Road Statistics [e-publication].
ISSN=2670-3386. 2019. Helsinki: Statistics Finland [referred: 18.4.2024].
Access method: http://www.stat.fi/til/tiet/2019/tiet_2019_2020-04-15_tie_001_en.html