

Published: 20 July 2012
Recovery of households’ net financial assets continued in the first quarter of 2012
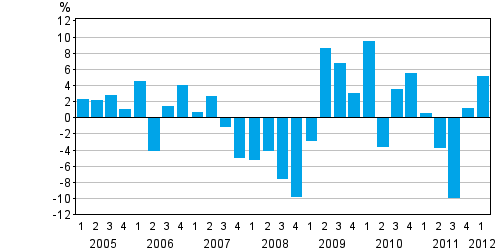
The recovery of households’ net financial assets that had started in the last quarter of 2011 continued also in the first quarter of 2012. Households’ net financial assets grew by 5.1 per cent. The main reason for the growth in households’ net financial assets can be found from stock market prices, which were higher at the end of March 2012 than at the end of 2011. Households’ debts, in turn, were hiked up by continued steady escalation of borrowing. At the end of the first quarter of 2012, households’ net financial assets, i.e. difference between their financial assets and liabilities, amounted to EUR 95.7 billion. These data derive from Statistics Finland’s financial accounts statistics.
Change from the previous quarter in households' net financial assets
Households’ indebtedness continued to grow. The growth from the end of 2011 amounted to EUR 1.2 billion which pushed the stock of debts up to EUR 127.4 billion. The speed of the growth of debts as such has been decelerating steadily over the latest three quarters. While in the second quarter of 2011 households’ debts still grew at the rate of 2 per cent, in the first quarter of 2012 the rate was only one per cent or so.
At the end of March 2012, stock market prices had recovered from their level at the end of 2011, which was reflected as growth in holding gains from the quoted shares owned by households. Net amounts invested in shares also increased in the first quarter of 2012. The combined effect from these factors was that the value of the quoted shares held by the household sector rose by nearly 15 per cent. Similar development could also be seen in mutual fund shares, for which the growth amounted to nearly 10 per cent. By contrast, households’ deposits turned to slight decline. This happened for the first time since the third quarter of 2009. Deposits diminished by 0.7 per cent to EUR 79.7 billion. As other changes were quite moderate, changes in stock market prices accounted for most of the growth in the net financial assets of households.
Non-financial corporations increased their debt financing by EUR 4.0 billion but also boosted their deposits by EUR 1.8 billion. The growth in the sector’s debt financing raised its level for the first time above the EUR 200 billion mark to EUR 203.1 billion. At the end of the first quarter of 2012, non-financial corporations had EUR 192.2 billion more debts than financial assets.
The classification of money market funds was revised in financial accounts as of the beginning of 2012. As the definition of money market funds changed, a significant number of them became classified as investment funds, which can also be seen as respective level changes in the balance sheets of the sectors concerned.
Source: Financial accounts, Statistics Finland
Inquiries: Peter Parkkonen 09 1734 2571, rahoitus.tilinpito@stat.fi
Director in charge: Ari Tyrkk�
Publication in pdf-format (246.4 kB)
- Tables
-
Tables in databases
Pick the data you need into tables, view the data as graphs, or download the data for your use.
Appendix tables
- Figures
Updated 20.7.2012
Official Statistics of Finland (OSF):
Financial accounts [e-publication].
ISSN=1458-8145. 1st quarter 2012. Helsinki: Statistics Finland [referred: 18.4.2024].
Access method: http://www.stat.fi/til/rtp/2012/01/rtp_2012_01_2012-07-20_tie_001_en.html