

This set of statistics has been discontinued.
Statistical data on this topic are published in connection with another set of statistics.
Data published after 5 April 2022 can be found on the renewed website.
Published: 27 May 2011
Surplus of international trade in services grew in 2010
According to Statistics Finland’s preliminary data, the value of exports of services rose and that of imports of services fell in 2010. Services were exported in 2010 to the tune of around EUR 15.7 billion, while imports of services amounted to about EUR 11.4 billion. The surplus from international trade in services grew by nearly one third from 2009, being around EUR 4.3 billion in 2010.
Imports, exports and surplus of foreign trade in services 2002–2010, mill. euro
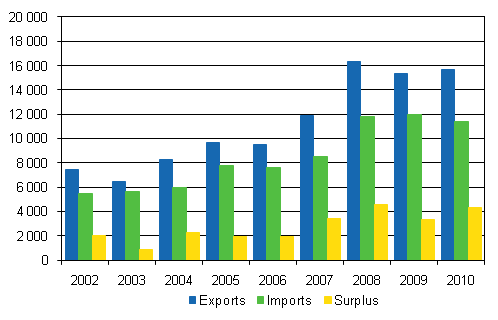
In 2010, exports of services rose to EUR 15.7 billion, which is around EUR 350 million more than in 2009. Imports of services fell by EUR 570 million from the year before. The surplus from international trade in services was in 2010 around EUR 4.3 billion, which is nearly EUR 920 million more than in the previous year.
The surplus grew particularly in royalty and licence fees, being EUR 840 million in 2010. The surplus in the same items in 2009 was EUR 340 million. In 2010 export revenue from royalty and licence fees amounted to nearly EUR 1.8 billion. Royalty and license fees include franchising and other similar rights and other royalties and licence fees.
In exports of services the key destination countries were India, Sweden and China. Exports to Sweden and the Netherlands grew from the year before. The decrease in exports to China and Russia is also noteworthy here. The most important import countries for services were Germany, the USA and the United Kingdom.
Service exports to EU15 countries rose to EUR 4.8 billion, which is 30 per cent of all exports of services. The share of EU15 countries increased by over two percentage points from 2009. Imports from EU15 countries fell in 2010 to under EUR 6.0 billion. The share of EU15 countries in all imports of services went down to 52 per cent, which indicates a six-percentage point fall from 2009.
The statistics on international trade in services are based on Statistics Finland's annual and quarterly inquiries on international trade in services. The data include service trade between group enterprises. The statistics do not include transportation, travel, insurance and financial services. The data are used in the calculation of national accounts and as part of the balance of payments compiled by the Bank of Finland.
Source: Foreign trade in services 2010, preliminary results, Statistics Finland
Inquiries: Risto Sippola +358 9 1734 3383, Marjatta Tenhunen +358 9 1734 2927, globalisaatio.tilastot@stat.fi
Director in charge: Leena Storg�rds
Publication in pdf-format (276.7 kB)
- Tables
-
Tables in databases
Pick the data you need into tables, view the data as graphs, or download the data for your use.
Appendix tables
- Appendix table 1. Imports of services by service type 2002-2010, mill. euro (27.5.2011)
- Appendix table 2. Exports of services by service type, 2002-2010, mill. euro (27.5.2011)
- Appendix table 3. Exports of services by country, 2002-2010, mill. euro (27.5.2011)
- Appendix table 4. Imports of services by country, 2002-2010, mill. euro (27.5.2011)
Updated 27.5.2011
Statistics:
International trade in services [e-publication].
ISSN=1798-3525. 2010. Helsinki: Statistics Finland [referred: 19.4.2024].
Access method: http://www.stat.fi/til/pul/2010/pul_2010_2011-05-27_tie_001_en.html