

Published: 15 March 2017
Current account in deficit in the fourth quarter, deficit in 2016 grew from the previous year
The current account showed a deficit in the last quarter of 2016 as net exports of goods and services fell clearly. Capital flowed abroad from Finland. According to Statistics Finland's preliminary data, the current account deficit for the whole of 2016 increased from the year before as the value of exports fell. The year 2016 was the sixth successive year when the current account was in deficit.
Current account and trade account
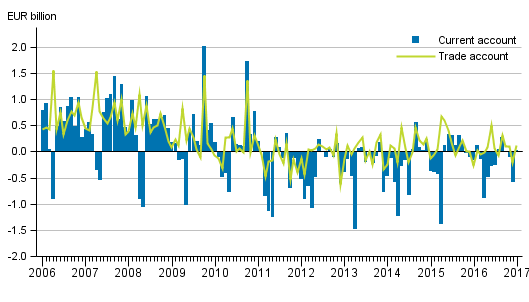
Current account in the fourth quarter and preliminary annual data
The current account showed a deficit of EUR 0.6 billion in the fourth quarter of 2016 and net exports of goods and services were EUR 0.8 billion in deficit.
In 2016, the current account was EUR 2.3 billion in deficit. The deficit grew from the previous year’s EUR 1.2 billion. Net exports of goods and services fell clearly in 2016, as the deficit of the service account grew and the surplus of the goods account fell. The growth in the current account deficit both in the fourth quarter and in the whole of 2016 became less steep because the primary income account was in surplus.
Exports of goods in balance of payment terms rose by one per cent in the fourth quarter from the corresponding period in the year before. Imports of goods in balance of payment terms went up by two per cent. The trade account was in balance.
The surplus of the trade account for the whole of 2016, EUR 0.6 billion, fell clearly from the previous year, when the surplus amounted to EUR 2.0 billion. The value of goods exports went down by two per cent from one year back as the value of goods imports grew by one per cent.
The service account showed a deficit of EUR 0.8 billion in the last quarter. The value of service exports remained at the same level as in the corresponding quarter last year. The deficit of the service account for the whole year was EUR 2.7 billion, which is explained, for example, by the travel balance being EUR 2.2 billion in deficit. In 2016, service exports fell by two per cent from the previous year.
Import and export figures in balance of payments terms by service item and area can be found in the statistics on international trade in goods and services . Decreases and increases made to the Finnish Customs figures are also broken down in the statistics on international trade in goods and services. In this way, we come to the goods trade in balance of payments terms. The balance of payments data have been calculated in accordance with the BPM6 manual (Balance of Payments and International Investment Position manual, Sixth Edition). The figures published by Finnish Customs follow the IMTS manual (International Merchandise Trade Statistics).
Recording of factoryless goods production in international trade has changed from 2014 onward, see changes in these statistics.
The primary income account was EUR 1.0 billion in surplus in the fourth quarter, which is explained by the surplus of investment income. The primary income account includes investment income like interests and dividends. According to preliminary data, the primary income account was EUR 1.7 billion in surplus in 2016, while in the previous year, the surplus amounted to EUR 1.2 billion.
The secondary income account was EUR 0.8 billion in deficit in the fourth quarter of 2016. In 2016, the secondary income account was EUR 2.0 billion in deficit.
Current account in January 2017
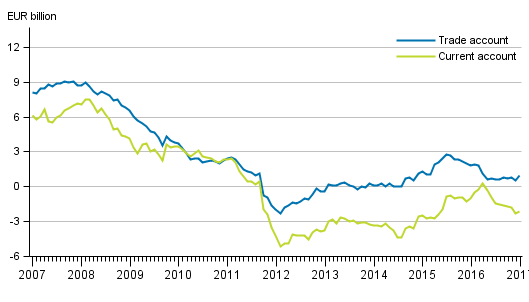
In January, the current account was almost in balance. The 12-month moving total of the current account was EUR 2.1 billion in deficit. Exports of goods in balance of payment terms rose by 28 per cent from twelve months back. The increase was mostly due to the exceptionally weak reference month. Goods imports rose by 16 per cent. Also the increase of imports was mostly due to the exceptionally weak reference month. The trade account in balance of payment terms was EUR 0,1 billion in surplus in January and reference month was EUR 0.3 billion in deficit. Of the sub-items, the primary income account was EUR 1.1 billion in surplus.
Finland’s current account and trade account, 12 –month moving sum
Financial account and net international investment position
The net international investment position strengthened, capital flowed from Finland
In the last quarter of 2016, net capital outflow from Finland amounted to EUR 1.1 billion. Capital inflow to Finland was most in the form of portfolio investments, EUR 4.7 billion on net. Capital outflow from Finland was most in the form of other investments, EUR 5.7 billion on net.
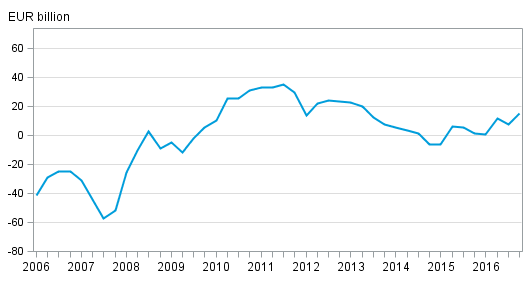
At the end of 2016, Finland had EUR 693.7 billion in foreign assets and EUR 678.4 billion in foreign liabilities. Finland's net international investment position rose in the fourth quarter on account of changes in other investments and direct investments. In particular, assets and liabilities on other investments decreased significantly from the previous quarter. Price changes related to foreign assets and liabilities boosted the net investment position by EUR 3.8 billion. Securities' portfolio investments grew as a result of risen stock market prices. Changes in exchange rates and other valuation changes improved the net investment position by EUR 3.0 billion.
Examined by sector, the net international investment position of employment pension funds grew by EUR 5.2 billion as a result of grown foreign assets. The net international investment position of other financial corporations and the non-financial corporations sector also grew in October to December.
Table 1. External assets and liabilities by investment type, EUR billion
| Opening positiion 30.09.2016 | Financial transactions 2016 Q4 | Price changes 2016 Q4 | Changes in the exchange rates and valuation adjustments 2016 Q4 | Closing position 31.12.2016 | |
| Financial account | 7.4 | 1.1 | 3.8 | 3.0 | 15.3 |
| Assets | 738.3 | -65.6 | 14.7 | 6.2 | 693.7 |
| Liabilities | 730.9 | -66.7 | 10.9 | 3.3 | 678.4 |
| Direct investment | 32.9 | 1.4 | 1.3 | 1.7 | 37.1 |
| Assets | 143.3 | -0.2 | 1.3 | 1.4 | 145.8 |
| Liabilities | 110.4 | -1.5 | 0.1 | -0.2 | 108.7 |
| Portfolio investment | 2.4 | -4.7 | 2.3 | 2.0 | 2.0 |
| Assets | 303.9 | -1.4 | 2.0 | 3.4 | 307.8 |
| Liabilities | 301.5 | 3.3 | -0.4 | 1.4 | 305.8 |
| Other investment | -41.4 | 5.7 | 0.0 | -0.8 | -36.5 |
| Assets | 179.7 | -39.2 | 0.0 | 1.3 | 141.7 |
| Liabilities | 221.1 | -44.9 | 0.0 | 2.1 | 178.2 |
| Financial derivatives | 3.5 | -1.2 | 0.5 | 0.0 | 2.8 |
| Reserve assets | 10.0 | 0.0 | -0.2 | 0.2 | 9.9 |
Financial account and international investment position in January 2017
In January, the outward capital flow on net from Finland was EUR 11.8 billion. The financial account was affected by a company restructuring made in the financial sector in January. The outward capital flow was mostly in the form of portfolio investments, altogether EUR 8.6 billion.
The data for February will be published on 13 April 2017.
Finland’s international investment position quarterly
Source: Balance of payments and international investment position, Statistics Finland
Inquiries: Tapio Kuusisto 029 551 3318, Saana Ranta-Ruona 029 551 3375, balanceofpayments@stat.fi.
Director in charge: Ville Vertanen
Publication in pdf-format (300.0 kB)
- Tables
-
Tables in databases
Pick the data you need into tables, view the data as graphs, or download the data for your use.
Appendix tables
- Appendix table 1. Finland's current account, quarterly 2016, EUR million (15.3.2017)
- Appendix table 2. External assets and liabilities by sector, quarterly 2016, EUR million (15.3.2017)
- Appendix table 3. International investment position by sector, quarterly 2016, EUR million (15.3.2017)
- Appendix table 4. Balance of payments 2017, EUR million (15.3.2017)
Updated 15.3.2017
Official Statistics of Finland (OSF):
Balance of payments and international investment position [e-publication].
ISSN=2342-348X. January 2017. Helsinki: Statistics Finland [referred: 17.4.2024].
Access method: http://www.stat.fi/til/mata/2017/01/mata_2017_01_2017-03-15_tie_001_en.html