

Published: 27 April 2017
Fourty-four per cent of elected councillors in Municipal elections 2017 are new municipal councillors
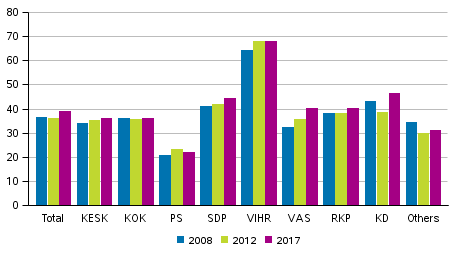
Altogether, 8,999 councillors were elected to municipal councils in the Municipal elections 2017. Of the elected councillors, 39.0 per cent were women, which is 0.9 percentage points fewer than among the candidates nominated by the parties. However, the share of women among those elected as councillors increased by 2.8 percentage points from the previous elections.
Share of women among elected councillors by party in Municipal elections 2008, 2012 and 2017, %
The average age of all councillors elected in the Municipal elections was 50.7 years. Current councillors made up 56.1 per cent of the elected councillors. Among the parliamentary parties, most current councillors were elected for another council term in relative terms among Finns Party candidates, 62.2 per cent. In relative terms, most new municipal councillors were, in turn, elected among Green League candidates, 65.7 per cent.
Of the elected councillors, 92.7 per cent were Finnish or Sami speakers, 6.5 per cent were Swedish speakers and 0.7 per cent had some other native language. Among the parliamentary parties, most foreign-language speakers, 1.9 per cent, were elected among Green League candidates in relative terms.
Based on the main type of activity, 80.6 per cent of all elected councillors in the Municipal elections were employed, 4.2 per cent were unemployed and 15.2 per cent were in the inactive population. Among the parliamentary parties, the Coalition Party (85.1%) has the most employed councillors in relative terms, and the Left Alliance has the least (70.8%).
Background analysis of elected councillors by party in the Municipal elections 2017
| Party | Councillors in municipal councils (%) |
Average age of candidates |
Finnish and Sami speakers (%) |
Swedish speakers (%) |
Other language speakers (%) |
Employed (%) |
Unemployed (%) |
In the inactive population (%) |
Average income |
| Centre Party of Finland |
58.4 | 50.6 | 99.6 | 0.1 | 0.2 | 84.8 | 3.0 | 12.2 | 45,543 |
| National Coalition Party |
56.2 | 49.7 | 97.9 | 1.5 | 0.5 | 85.1 | 2.3 | 12.6 | 67,152 |
| Finns Party |
62.2 | 49.3 | 98.8 | 0.4 | 0.8 | 73.6 | 8.8 | 17.6 | 39,580 |
| Finnish Social Democratic Party |
59.3 | 53.0 | 95.9 | 2.9 | 1.2 | 77.3 | 4.2 | 18.5 | 44,255 |
| Green League |
34.3 | 43.2 | 95.9 | 2.2 | 1.9 | 82.6 | 6.7 | 10.7 | 41,126 |
| Left Alliance |
56.8 | 53.6 | 97.7 | 1.1 | 1.2 | 70.8 | 6.7 | 22.5 | 39,897 |
| Swedish People’s Party in Finland |
54.6 | 50.1 | 5.1 | 93.4 | 1.5 | 82.8 | 2.1 | 15.1 | 53,998 |
| Christian Democrats in Finland |
44.0 | 53.2 | 88.6 | 11.1 | 0.3 | 74.4 | 5.4 | 20.3 | 45,538 |
| Others | 50.2 | 52.5 | 92.9 | 5.9 | 1.3 | 74.8 | 6.7 | 18.5 | 43,647 |
| All elected councillors |
56.1 | 50.7 | 92.7 | 6.5 | 0.7 | 80.6 | 4.2 | 15.2 | 48,087 |
The average income subject to state taxation of all elected councillors is EUR 48,087 per year. Among the parliamentary parties, the newly elected councillors of the Coalition Party have the highest average income, EUR 67,152, and the newly elected councillors of the Finns Party have the lowest, EUR 39,580.
More detailed data on the candidates and elected councillors of the Municipal elections can be found in the review: Background analysis of candidates and elected councillors in Municipal elections 2017.
Statistics Finland's election result services
Statistics Finland releases a review on the background of Municipal election candidates and elected councillors analysing the candidates' gender distribution, age, origin, education, employment, income level and family status in comparison to persons entitled to vote.
Statistics Finland's free of charge election map service on the web contains data illustrated by maps and charts on the Municipal election. The themes include voting turnout, the party with the most votes and support for parties and change in the support and the proportion of young, female and new councillors. The data can be browsed by various area categories such as municipalities, constituencies and the largest towns by voting district.
More detailed election result data are available in Statistics Finland's PX-Web database service where users can compile customised statistical tables on the elections. .
Source: Municipal Elections 2017, background analysis of candidates and elected representatives, Statistics Finland
Inquiries: Sami Fredriksson 029 551 2696, Kaija Ruotsalainen 029 551 3599, Jaana Asikainen 029 551 3506, vaalit@stat.fi
Director in charge: Jari Tarkoma
Publication in pdf-format (727.2 kB)
- Reviews
- Tables
-
Tables in databases
Pick the data you need into tables, view the data as graphs, or download the data for your use.
- Quality descriptions
-
- Municipal elections, quality description (27.4.2017)
Updated 27.4.2017
Official Statistics of Finland (OSF):
Municipal elections [e-publication].
ISSN=2323-1114. confirmed result 2017. Helsinki: Statistics Finland [referred: 18.4.2024].
Access method: http://www.stat.fi/til/kvaa/2017/04/kvaa_2017_04_2017-04-27_tie_001_en.html