

Published: 21 December 2020
Greenhouse gas emissions fell in 2019, emission reduction targets for 2013 to 2020 attainable
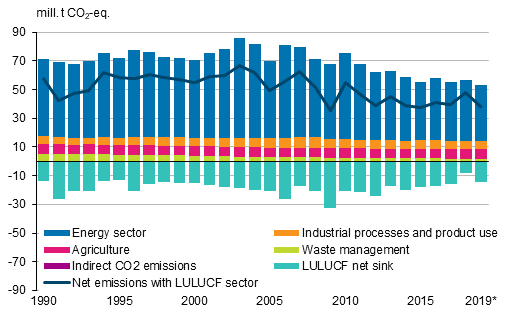
According to Statistics Finland's preliminary data, the total emissions of greenhouse gases in 2019 correspond with 53.1 million tonnes of carbon dioxide equivalent (CO2 eq.), being 18.2 million tonnes less than in the comparison year 1990. Emissions fell by six per cent from the previous year. The fall in emissions was most influenced by the decreased use of coal and peat. Emissions not included in the EU Emissions Trading System fell by one per cent but exceeded the annual emission allocation set by the EU by 0.6 million tonnes of CO2 equivalent. The net sink of the land use, land use change and forestry (LULUCF) sector, that is, the sum of removals and emissions, amounted to −14.7 million tonnes CO2 equivalent in 2019, but these data are not included in total emissions. The data published are based on the preliminary report to be submitted by Statistics Finland to the European Commission by 15 January 2021 concerning emissions in 2019.
Finland's greenhouse gas emissions and removals by sector and the sum of all sectors, where the net sink of the LULUCF sector is deducted from the combined emissions of other sectors
*Preliminary data.
LULUCF refers to the land use, land use change and forestry sector. Negative figures are removals of greenhouse gases. The sector does not come under the scope of the EU Emissions Trading System or the reduction targets of EU's Effort Sharing Decision. The figures for the latest years will become revised as the source data are updated (e.g. growing stock and surface areas).
According to the preliminary data, total emissions in 2019 fell by close to six per cent compared with the previous year. The sum of emissions and removals in the LULUCF sector, or the net sink are not included in the total emissions. In the energy sector, emissions fell by seven per cent, the fall was most affected by lower consumption of coal and peat (link to the energy release ). Emissions from industrial processes and product use decreased by six per cent and those from the waste sector by one per cent from 2018 to 2019, while those from agriculture grew by two per cent. The net sink of the land use, land use change and forestry sector (LULUCF), that is, the sum of emissions and removals was -14.7 million tonnes of CO2 eq. in 2019, or 79 per cent higher than in the year before. Especially the six per cent reduction in fellings compared to the top year of fellings, 2018, increased the net sink of the land use sector. Calculation of the net sink becomes revised yearly for the penultimate years. This is due to utilisation of new data, e.g. national forest inventory data, in the calculation. New data affect, e.g. the areas and growing stock which, in turn, affect the litter input to the soil and thus the soil carbon storage (see the review (in Finnish)).
Greenhouse gas emissions in Finland by sector
| Emissions, million tonnes CO2 eq. | |||||||||
| 1990 | 2000 | 2005 | 2010 | 2015 | 2016 | 2017 | 2018 | 2019 4) | |
| Emissions without LULUCF sector 1) | 71.2 | 70.3 | 69.9 | 75.7 | 55.1 | 58.1 | 55.3 | 56.3 | 53.1 |
| Energy sector | 53.5 | 53.7 | 53.7 | 60.2 | 40.6 | 43.4 | 41.0 | 42.1 | 39.1 |
| Energy industries | 19.0 | 22.1 | 22.1 | 30.9 | 17.8 | 19.2 | 17.5 | 18.7 | 16.3 |
| Manufacturing industries and construction | 13.4 | 12.0 | 11.4 | 10.0 | 6.8 | 6.8 | 6.7 | 6.8 | 6.6 |
| Transport | 12.1 | 12.1 | 12.9 | 12.7 | 10.9 | 12.1 | 11.5 | 11.7 | 11.3 |
| Other energy 2) | 9.0 | 7.5 | 7.3 | 6.5 | 5.2 | 5.3 | 5.4 | 5.0 | 5.0 |
| Industrial processes and products use | 5.4 | 6.0 | 6.8 | 6.2 | 5.8 | 6.0 | 5.8 | 5.8 | 5.5 |
| Industrial processes (excl. F-gases) 3) | 5.3 | 5.2 | 5.6 | 4.8 | 4.4 | 4.7 | 4.6 | 4.6 | 4.4 |
| Consumption of F-gases 3) | 0.1 | 0.7 | 1.2 | 1.4 | 1.3 | 1.3 | 1.2 | 1.2 | 1.2 |
| Agriculture | 7.5 | 6.6 | 6.5 | 6.7 | 6.6 | 6.7 | 6.5 | 6.5 | 6.6 |
| Waste management | 4.7 | 3.8 | 2.8 | 2.6 | 2.1 | 2.0 | 1.9 | 1.8 | 1.8 |
| Indirect CO2 emissions | 0.2 | 0.1 | 0.1 | 0.1 | 0.1 | 0.1 | 0.1 | 0.1 | 0.1 |
| LULUCF sector 1) | -13.6 | -15.1 | -20.6 | -20.8 | -18.0 | -17.0 | -15.7 | -8.2 | -14.7 |
2) Other energy includes sub-categories heating of buildings, fuel use in agriculture, forestry and fisheries (incl. machinery), other fuel use and fugitive emissions from fuels.
3) F-gases refer to fluorinated greenhouse gases (HFC, PFC compounds, SF6 and NF3).
4) Preliminary data
Emissions not included in the EU ETS are calculated as the difference between the total emissions and verified emissions in the EU ETS sector, from which CO2 emissions from domestic civil aviation as calculated in the inventory are deducted. The data on the verified emissions of the sectors in the EU ETS (in Finnish) are published by the Energy Authority.
Annual emission allocations for the years 2013 to 2020 have been defined in the EU's Effort Sharing Decision for emissions not included in the ETS. Although emissions have decreased in 2018 and 2019 compared to previous years, the target path is exceeded in these years as well as in 2016. However, these can be compensated for with the emissions allocations not used in 2013 to 2015 and 2017.
During the Kyoto Protocol's second commitment period, Finland's emissions not included in the EU Emissions Trading System must be limited to 240.5 million tonnes of CO2 eq. Based on the data until now, Finland will meet its commitment but will probably have to use emission units acquired from the flexible mechanisms established by the Kyoto Protocol so it can cover for the additional burden from Kyoto Protocol LULUCF activities. More information in Finnish is available in the Review of the release .
The target path for emissions not included in the EU Emissions Trading System for the period 2013 to 2020, corresponding revised emission data for 2013 to 2018 and data from the latest inventory submission for 2019 and their difference to the target path
| 2013 | 2014 | 2015 | 2016 | 2017 | 2018 | 2019 | 2020 | |
| Million tonnes of CO2 eq. | ||||||||
| Target path for Finland in accordance with the EU's Effort Sharing Decision | 31.8 | 31.3 | 30.8 | 30.3 | 30.2 | 29.6 | 29.1 | 28.5 |
| Emissions not included in the EU ETS 1) | 31.6 | 30.1 | 29.9 | 31.4 | 30.1 | 29.9 | 29.7 3) | |
| Difference to the target path 2) | -0.2 | -1.1 | -0.9 | 1.0 | -0.1 | 0.3 | 0.6 | |
2) The difference to the target path is expressed as a negative figure when the realised emissions are below the path and as a positive figure when they are higher than the target path emissions.
3) Preliminary data
Source: Greenhouse gas inventory unit. Statistics Finland
Inquiries: Pia Forsell 029 551 2937, P�ivi Lindh 029 551 3778, Sini Niinist� (LULUCF) 029 551 2954, kasvihuonekaasut@stat.fi
Head of Department in charge: Mari Yl�-Jarkko
Publication in pdf-format (199.9 kB)
- Tables
-
Tables in databases
Pick the data you need into tables, view the data as graphs, or download the data for your use.
- Revisions in these statistics
-
- Revisions in these statistics (21.12.2020)
Updated 21.12.2019
Official Statistics of Finland (OSF):
Greenhouse gases [e-publication].
ISSN=1797-6065. 2019. Helsinki: Statistics Finland [referred: 16.4.2024].
Access method: http://www.stat.fi/til/khki/2019/khki_2019_2020-12-21_tie_001_en.html