

Published: 15 June 2018
Exports of ICT services fell in the first quarter of 2018
Service exports continued growing in the first quarter of 2018, up by two per cent year-on-year. In particular, transport services, manufacturing services and other business services increased. Travel to Finland also grew. However, the growth of service exports has evened out, as service exports went down for ICT services and charges for the use of intellectual property n.i.e. Sweden was the most significant country of exports for Finland in both goods and services. The data appear from Statistics Finland's statistics on international trade in goods and services, which are part of balance of payments .
Imports and exports of services
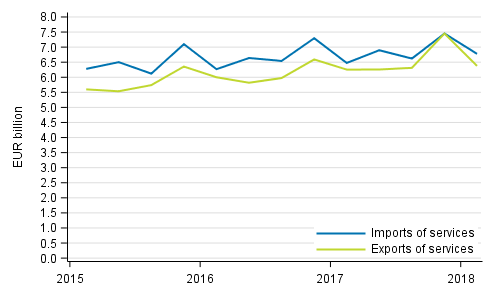
The combined exports of goods and services grew by four per cent and imports by six per cent in the first quarter of 2018 compared with the corresponding quarter in 2017. In balance of payments terms, goods exports grew by five per cent and goods imports by seven per cent.
Travel to Finland grew
Both travel abroad from Finland and to Finland grew in the first quarter of 2018 from one year back. The value of travel expenditure abroad from Finland, which is included in the statistics as travel imports, grew by five per cent. Travel to Finland (included as travel exports), in turn, grew by eight per cent in the first quarter of 2018 year-on-year.
However, more travel services are still imported than exported. Finland received income from travel services to the value of EUR 0.7 billion in the first quarter of 2018. Expenditure abroad from Finland amounted to slightly over EUR one billion.
Travel exports include such as the goods and services consumed by a person having travelled to Finland either for a leisure or business trip for under one year.
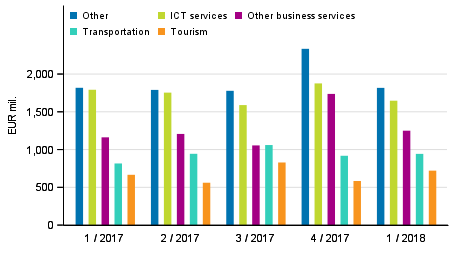
Rise in exports of transport services balanced out the losses in exports caused by the decrease in ICT service exports
Measured in euros, service exports grew most due to exports of transport services, which rose by 16 per cent (EUR 127 million) compared to the corresponding quarter last year. Transport exports include such as income from freight and passenger transport and postal and courier services to Finland.
Exports of manufacturing services rose by 23 per cent. An example of exports of this service item is that a Finnish enterprise assembles, processes or packs goods it does not own, but receives a payment for the (assembly) services it produces from a foreign owner.
In turn, eight per cent more other business services were exported in the first three months of 2018 than in the first quarter of 2017. Growth from the first quarter of the previous year came particularly from the sub-item belonging to other business services: professional and management consulting services. This item usually includes services a parent company offers to its affiliates.
The growth in service imports was, however, curbed by decreased exports of two service items. Exports of telecommunications, computer and information services (ICT services) were eight per cent down (EUR 145 million) on the corresponding quarter of the year before. Exports of charges for the use of intellectual property n.i.e. declined by seven per cent. The latter item includes such as income from property rights generated as a result of research and development services. The item also includes payments and fees related to franchise agreements and trademarks, as well as licences related to the distribution of computer software and licensing fees for trademarks.
Exports of services by service item
Imports of manufacturing services grew significantly
Service imports grew by five per cent in the first quarter of 2018. Imports of transport services had most effect on the growth of service imports. Imports of transport services grew in euros as much as their exports. Ten per cent more of these services were imported to Finland in the first quarter of 2018 than in the corresponding quarter last year. Imports of manufacturing services grew by as much as 35 per cent. In imports of manufacturing services, a Finnish enterprise pays a foreign enterprise a processing premium, for example, for processing of raw materials, such as metal or oil.
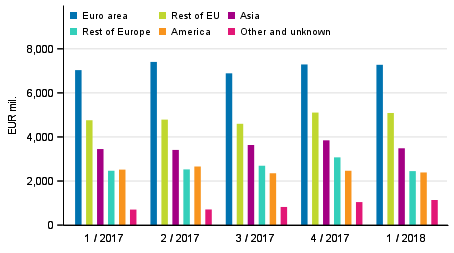
Sweden was Finland’s most important country of exports for both goods and services
Goods and services were exported most to Sweden in the first quarter of 2018. Goods exports to Sweden amounted to EUR 1.9 billion. Goods exports to Sweden grew by 12 per cent compared to the quarter of one year ago. The value of goods exports to Germany totalled EUR 1.4 billion. In turn, goods were imported from Germany at a higher value than exported there, that is, goods trade to Germany was in deficit.
Goods and services in balance of payments terms exported to Germany amounted to EUR 333 million more at the beginning of this year than in the first quarter of 2017. Service exports to Germany grew by 31 per cent, while goods exports went up by just 16 per cent. Germany accounted for 10 per cent of Finland's service exports in the first quarter of 2018. Germany's share of service exports from Finland to Europe was 15 per cent. In goods, these shares were slightly smaller: 9 and 13 per cent.
In these statistics, statistics on goods trade are based on change of ownership. The statistics compilation by Finnish Customs is based on border crossing. This definition has a significant effect when comparing statistics on German export figures compiled by Finnish Customs and Statistics Finland.
International trade in services to the United States still in surplus
After Sweden, services were particularly exported to the United States, where nine per cent fewer services were exported in the first quarter of 2018 than in the first quarter of 2017. Imports from the United States also declined. They fell by 15 per cent. Service trade to the United States is still in surplus: services exported there amounted to nearly EUR 0.3 billion more than imports from there.
Services exported to Sweden totalled EUR 0.8 billion in the first quarter of 2018. Thus, the level of service exports to Sweden did not change from the first quarter of 2017. EUR 0.1 billion more services were imported from Sweden than exported there. Service imports from Sweden grew by 10 per cent in the first quarter of 2018.
More services are also imported from the United Kingdom than exported there. However, the value of service exports to the United Kingdom measured in euros, EUR 328 million, is only around one-half of the services exported to the United States. Service exports to Russia grew by 13 per cent, while the level of service imports did not change from the year before. Ten per cent more services were exported to China and 13 per cent fewer were imported than at the beginning of 2017.
Exports of goods and services in balance of payments terms by area
Statistics on international trade
The statistics on international trade in goods and services are part of balance of payments . The statistics comprise breakdowns of goods and services on a more detailed level. The guidelines and recommendations of the Balance of Payments Manual (BPM6) applied to balance of payments are consistent with the European System of Accounts (ESA 2010). National Accounts are published on quarterly and annual levels . Finnish Customs publishes data on goods trade across borders. Goods trade published by Finnish Customs is used as source data for the statistics on international trade in goods and services. Removals and additions caused by definitions are made to them to achieve goods trade in balance of payments terms.
Finnish Customs’ statistical service, tilastot@tulli.fi, +358 29 552 335.
Source: International trade in goods and services 2018, Statistics Finland
Inquiries: Risto Sippola 029 551 3383, Terhi Tulonen 029 551 3604, globalisaatio.tilastot@stat.fi
Director in charge: Ville Vertanen
Publication in pdf-format (270.7 kB)
- Tables
-
Tables in databases
Pick the data you need into tables, view the data as graphs, or download the data for your use.
Appendix tables
- Revisions in these statistics
-
- Revisions in these statistics (15.6.2018)
Updated 15.6.2018
Official Statistics of Finland (OSF):
International trade in goods and services [e-publication].
ISSN=2343-4244. 1st quarter 2018. Helsinki: Statistics Finland [referred: 18.4.2024].
Access method: http://www.stat.fi/til/tpulk/2018/01/tpulk_2018_01_2018-06-15_tie_001_en.html