

Published: 24 April 2020
Decrease in birth rate slowed down in 2019
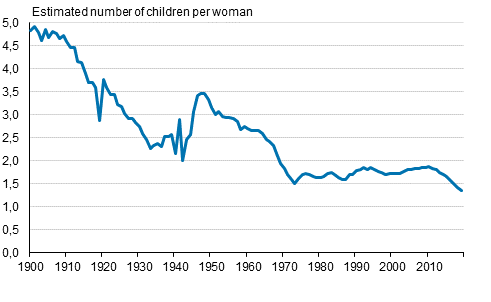
According to Statistics Finland’s data on population changes, the birth rate went down for the ninth year in a row, but the fall was less sharp in 2019. At the birth rate prevailing in 2019, a woman would give birth to an average of 1.35 children, according to the previous year's birth rate the number was 1.41 children. The fall in the birth rate became less sharp especially due to the development in the last months of the year, when the number of births did not decline any more as it did in the early part of the year. A total of 45,613 babies were born in 2019, which is 1,964 fewer than in the year before. The number of births had gone down by 2,744 children in 2018 from the previous year.
Total fertility rate in 1900 to 2019
When the number of births is taken as a proportion to the number of women of childbearing age, the birth rate can be examined. The birth rate is commonly measured with the total fertility rate, which indicates how many children a woman would give birth to during her life time if the birth rate remained the same as in the year on which the calculation is based.
In 2019, the total fertility rate measuring the birth rate was the lowest of all times, 1.35 children per woman. The birth rate has been falling throughout the 2010s and the fall steepened after 2015, but in 2019 it was less sharp. The total fertility rate diminished by 4.3 per cent from the previous year, while in 2018 it had fallen by 5.5 per cent.
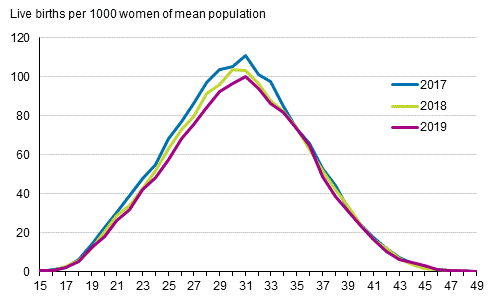
In 2019, the birth rate still declined most significantly for those aged 24 to 32, but less than in 2018. For persons aged 32 or over the fall in the birth rate was smaller in 2019 than in 2018, as a result of this women who gave birth to their first child were slightly older than in the year before. On average, first-time mothers were aged 29.6 years, 0.2 years older than in the previous year (see the table). In ten years, the mean age at first confinement has risen by 1.4 years. Correspondingly, the average age of all women who gave birth to live children rose from the previous year by 0.1 years, to 31.2. In the past ten years, it has risen by 1.1 years.
Age-specific fertility rates 2017, 2018 and 2019
First-time fathers were also slightly older than in the previous year. On average, first-time fathers were aged 31.6 years, up by 0.2 years from the year before. The average age of all men who became fathers was 33.6 years, one tenth more than in the previous year. Data on fathers are based on population data in the statistical reference period, according to which a father is recorded for nearly 98 per cent of children in the Population Information System.
Nearly the same number of first children were born as in the year earlier
When the total fertility rate is broken down by the order number of the child, we can see the reasons for the fall in the birth rate slowing down and the rise in the age of becoming mothers (Appendix figure 3). The fall in the birth rate became less sharp mainly because nearly the same number of first children were born as in the previous year, whereby the birth rate did not fall as much as it had in 2018. The birth rate calculated by the first child diminished in 2019 by just 0.8 per cent, when in the previous year it had decreased by 5.4 per cent.
However, the corresponding figure calculated by the second child declined in relative terms almost as much as in the previous year, but the decrease calculated by the third child had slowed down from the previous year's 10.6 to 6.9 per cent. The fall in the birth rate slowing down from the previous year is explained by the birth rate of the first child, because its share of the total birth rate is highest, slightly over 40 per cent. As the birth rate still continued to fall, it was mainly caused by fewer second and third children being born in families than in the previous year.
Appendix figure 2 also shows clearly the reason why first-time mothers were slightly older than before. The average age of first-time mothers rose from the year before, because the fertility rates according to the first child diminished for those aged under 30 but grew for women older than that.
Birth rate rose in South Ostrobothnia, fell most in North Karelia
South Ostrobothnia was the only region where the birth rate rose from the previous year. While the total fertility rate of the region had diminished by 10 per cent in the previous year, in 2019 it grew by one per cent. In 2018, the figure was 1.64, from which it grew to 1.66 in 2019. Although the birth rate rose in South Ostrobothnia, the number of births went down from 1,600 to 1,598. In relative terms, the birth rate fell most in North Karelia, by 11 per cent, and in both North Savo and P�ij�t-H�me by slightly under nine per cent.
The birth rate was above the rate for the whole country in nine regions. At the 2019 birth rate, most children would be born in the regions of Ostrobothnia: on average, 1.77 children per woman in Central Ostrobothnia, 1.66 in Ostrobothnia and South Ostrobothnia, and 1.61 in North Ostrobothnia. The lowest numbers of children would be born in North Karelia, an average of 1.23 children per woman, and in South Karelia and Southwest Finland, 1.27 children per woman.
Although the birth rate is in relative terms highest in the regions of Ostrobothnia, in numbers most children are born in Uusimaa, 35 per cent of all births. Correspondingly, 17 per cent of births in the whole country were born in the regions of Ostrobothnia in 2019. The total fertility rate was 1,28 in the region of Uusimaa, which is the fourth lowest by regional comparison.
Birth rate highest in Porvoo and lowest in Helsinki
In municipalities with at least 50,000 inhabitants, the birth rate was highest in Porvoo, where the total fertility rate was 1.63 in the five-year period 2015 to 2019. The second highest rates were found in Sein�joki, 1.62 and Espoo, 1.60. The figure for the whole country in the five-year period was 1.49.
Respectively, the birth rate was lowest in the period 2015 to 2019 in Helsinki, where the total birth rate was 1.19. The rate was 1.21 in Turku and 1.23 in Tampere. The birth rates in Turku and Tampere were also among the lowest in a comparison of all municipalities.
Number of live births, total fertility rate and mother's mean age by live births in 2010 to 2019
| Year | 2010 | 2011 | 2012 | 2013 | 2014 | 2015 | 2016 | 2017 | 2018 | 2019 |
| Number of live births | 60 980 | 59 961 | 59 493 | 58 134 | 57 232 | 55 472 | 52 814 | 50 321 | 47 577 | 45 613 |
| Total fertility rate | 1,87 | 1,83 | 1,80 | 1,75 | 1,71 | 1,65 | 1,57 | 1,49 | 1,41 | 1,35 |
| Mother's mean age by all live births | 30,1 | 30,3 | 30,3 | 30,4 | 30,5 | 30,6 | 30,8 | 30,9 | 31,1 | 31,2 |
| Mother's mean age by first live birth | 28,3 | 28,4 | 28,5 | 28,6 | 28,6 | 28,8 | 29,1 | 29,2 | 29,4 | 29,6 |
Source: Births 2019. Statistics Finland
Inquiries: Timo Nikander 029 551 3250, info@stat.fi
Director in charge: Jari Tarkoma
Publication in pdf-format (356.5 kB)
- Tables
-
Tables in databases
Pick the data you need into tables, view the data as graphs, or download the data for your use.
- Figures
- Quality descriptions
-
- Quality description, births 2019 (24.4.2020)
Updated 24.4.2020
Official Statistics of Finland (OSF):
Births [e-publication].
ISSN=1798-2413. 2019. Helsinki: Statistics Finland [referred: 19.4.2024].
Access method: http://www.stat.fi/til/synt/2019/synt_2019_2020-04-24_tie_001_en.html