

Published: 13 April 2018
Retail trade sales grew by 3.3 per cent year-on-year in February
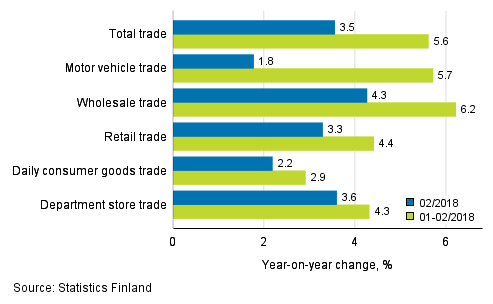
According to Statistics Finland, sales in total trade increased by 3.5 per cent in February from February 2017. Sales in wholesale trade grew by 4.3 per cent and in retail trade by 3.3 per cent. Among retail trade industries, sales in daily consumer goods trade grew by 2.2 per cent and in department store trade by 3.6 per cent from one year back. Motor vehicle sales increased by 1.8 per cent compared to February 2017.
Annual change in turnover in trade industries, % (TOL 2008)
Sales volume in total trade grew by 2.7 per cent year-on-year in February
The sales volume in retail trade was 2.8 per cent greater in February than twelve months earlier. The sales volume in wholesale trade also grew by the same amount. The sales volume in motor vehicle trade, in turn, grew by 2.0 per cent from the year before. The sales volume of total trade increased by 2.7 per cent in February from February 2017.
The volume index of sales is calculated by removing the effect of price changes from the value index series.
Sales in retail trade grew by 4.4 per cent in January to February
In the January to February period, sales went up by 4.4 per cent in retail trade and by 6.2 per cent in wholesale trade compared with the corresponding period of 2017. Sales in motor vehicle trade increased by 5.7 per cent over the same period. Total trade sales increased by 5.6 per cent from January to February 2017.
The reported annual changes in trade sales and sales volumes are not seasonally or trading day adjusted, which means that the effects of public holidays are not considered.
Source: Turnover of trade, Statistics Finland
Inquiries: Milka Suomalainen 029 551 2912, Seija Karttunen 029 551 2741, palvelut.suhdanne@stat.fi
Director in charge: Sami Saarikivi
Publication in pdf-format (253.5 kB)
- Tables
-
Tables in databases
Pick the data you need into tables, view the data as graphs, or download the data for your use.
Appendix tables
- Figures
- Revisions in these statistics
-
- Revisions in these statistics (13.4.2018)
Updated 13.04.2018
Official Statistics of Finland (OSF):
Turnover of trade [e-publication].
ISSN=1799-0939. February 2018. Helsinki: Statistics Finland [referred: 20.4.2024].
Access method: http://www.stat.fi/til/klv/2018/02/klv_2018_02_2018-04-13_tie_002_en.html