

Published: 20 December 2017
Total energy consumption rose by one per cent in January to September
According to Statistics Finland's preliminary data, total energy consumption in January to September amounted to 992 petajoule, which was one per cent more than in the corresponding period last year. Electricity consumption amounted to 62 terawatt hours (TWh), which is also one per cent more than one year earlier. Carbon dioxide emissions in the energy sector, in turn, fell by one per cent from last year.
Total energy consumption
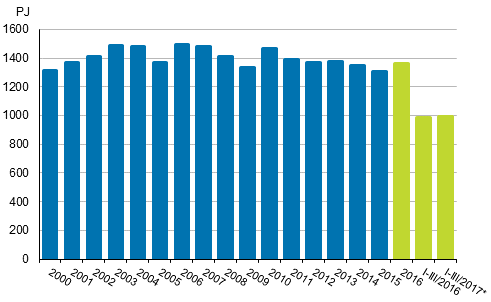
*preliminary
The consumption of wood fuels grew by seven per cent in January to September, and they were the biggest energy source with their 27 per cent share of total consumption. The consumption of natural gas and peat fell by two per cent. For oil, the decrease was one per cent. In turn, the consumption of coal remained at last year's level.
The volume of electricity produced with hydro power was 15 per cent lower than in January to September 2016. Electricity produced with nuclear power also decreased, in all by four per cent. In turn, net imports of electricity increased by 11 per cent from last year and their share of total electricity consumption was 25 per cent. Electricity produced with wind power grew by 69 per cent and its share of total consumption was five per cent.
In January to September, diverse energy products were imported into Finland to the value of EUR 6.4 billion, which was 27 per cent more than one year earlier. Most energy products were imported from Russia, whose share of the value of imports was 62 per cent. Energy products were exported to the value of EUR 3.5 billion, which was 24 per cent more than one year previously. Most energy products were exported from Finland to OECD countries, which accounted for 80 per cent of the value of exports.
Stocks of coal amounted to 16 TWh at the end of September, which was 12 per cent less than one year earlier. At the end of September, peat stocks were estimated to contain 15 TWh of energy peat, or 20 per cent less than one year ago.
Total energy consumption by source (TJ) and CO2 emissions (Mt)
| Energy source | I-III/2017* | Annual change-%* | Percentage share of total energy consumption* |
| Oil 1) | 232,571 | -1 | 23 |
| Coal 2) | 85,737 | 0 | 9 |
| Natural gas 3) | 50,638 | -2 | 5 |
| Nuclear energy 4) | 171,013 | -4 | 17 |
| Net imports of electricity 5) | 56,323 | 11 | 6 |
| Hydro power 5) | 38,409 | -15 | 4 |
| Wind power 5) | 11,528 | 69 | 1 |
| Peat | 37,791 | -2 | 4 |
| Wood fuels | 269,268 | 7 | 27 |
| Others 6) | 38,560 | -10 | 4 |
| TOTAL ENERGY CONSUMPTION | 991,839 | 1 | 100 |
| Bunkers | 27,877 | -5 | . |
| CO2 emissions from energy sector | 30 | -1 | . |
. = Category not applicable
1) Oil: includes the bio part of transport fuels.
2) Coal: includes hard coal, coke, blast furnace gas and coke oven gas.
3) The consumption of natural gas does not include raw material use.
4) Conversion of electricity generation into fuel units: Nuclear power: 10.91 TJ/GWh (33% total efficiency)
5) Conversion of electricity generation into fuel units: Hydro power, wind power and net imports of electricity: 3.6 TJ/GWh (100%)
6) Others: includes exothermic heat from industry, recovered fuels, heat pumps, hydrogen, biogas, other bioenergy and solar energy.
Source: Statistics Finland, Energy supply and consumption
Inquiries: Ville Maljanen 029 551 2691, energia@stat.fi
Director in charge: Ville Vertanen
Publication in pdf-format (259.5 kB)
- Tables
-
Tables in databases
Pick the data you need into tables, view the data as graphs, or download the data for your use.
- Figures
-
- Appendix figure 1. Changes in GDP, Final energy consumption and electricity consumption (20.12.2017)
- Appendix figure 2. Carbon dioxide emissions from fossil fuels and peat use (20.12.2017)
- Appendix figure 3. Coal consumption (20.12.2017)
- Appendix figure 4. Natural gas consumption (20.12.2017)
- Appendix figure 5. Energy peat consumption (20.12.2017)
- Appendix figure 6. Domestic oil deliveries (20.12.2017)
- Revisions in these statistics
-
- Revisions in these statistics (20.12.2017)
Updated 20.12.2017
Official Statistics of Finland (OSF):
Energy supply and consumption [e-publication].
ISSN=1799-7976. 3rd quarter 2017. Helsinki: Statistics Finland [referred: 24.4.2024].
Access method: http://www.stat.fi/til/ehk/2017/03/ehk_2017_03_2017-12-20_tie_001_en.html